
Dashboards have become an indispensable tool for revenue teams, serving as a centralized hub for data visualization and performance tracking. In an era where data-driven decision-making is paramount, dashboards provide a clear and concise way to present complex information. They allow revenue teams to monitor key performance indicators (KPIs) in real-time, enabling swift responses to market changes and internal performance issues.
By consolidating various metrics into a single interface, dashboards facilitate a comprehensive understanding of the revenue landscape, empowering teams to make informed decisions that drive growth. Moreover, dashboards enhance communication within revenue teams and across departments. When everyone has access to the same data visualizations, it fosters a culture of transparency and accountability.
Team members can easily share insights and collaborate on strategies, ensuring that everyone is aligned with the organization’s goals. This alignment is crucial in today’s fast-paced business environment, where agility and responsiveness can significantly impact a company’s bottom line. By leveraging dashboards, revenue teams can not only track their performance but also engage in meaningful discussions about strategies for improvement.
Key Sales Metrics to Monitor on Dashboards
Sales metrics are the lifeblood of any revenue team, providing insights into the effectiveness of sales strategies and the overall health of the sales pipeline. One of the most critical metrics to monitor is the conversion rate, which measures the percentage of leads that turn into paying customers. This metric helps teams identify bottlenecks in the sales process and assess the effectiveness of their sales tactics.
For instance, if a team notices a low conversion rate at a particular stage of the sales funnel, they can investigate further to determine whether it’s due to inadequate follow-up or a lack of product knowledge among sales representatives. Another essential metric is the average deal size, which provides insight into the revenue potential of each sale. By tracking this metric over time, revenue teams can identify trends in customer purchasing behavior and adjust their sales strategies accordingly.
For example, if the average deal size is increasing, it may indicate that customers are willing to invest more in higher-value solutions, prompting the team to focus on upselling and cross-selling opportunities. Additionally, monitoring sales velocity—how quickly deals move through the pipeline—can help teams optimize their processes and improve overall efficiency.
Essential Service Metrics to Include on Dashboards

In addition to sales metrics, service metrics play a crucial role in understanding customer satisfaction and retention. One key service metric is the Net Promoter Score (NPS), which gauges customer loyalty by asking how likely customers are to recommend a company’s products or services. A high NPS indicates strong customer satisfaction, while a low score may signal underlying issues that need addressing.
By including NPS on dashboards, revenue teams can track customer sentiment over time and correlate it with sales performance, providing valuable insights into how service quality impacts revenue. Another important service metric is customer churn rate, which measures the percentage of customers who stop using a company’s products or services over a specific period. High churn rates can be detrimental to revenue growth, as acquiring new customers is often more expensive than retaining existing ones.
By monitoring churn rates on dashboards, revenue teams can identify patterns and potential causes for customer attrition. For instance, if churn rates spike after a product update or service change, it may indicate that customers are dissatisfied with the new features or that additional training is needed for effective usage.
How Dashboards Help Revenue Teams Track Performance
Dashboards serve as powerful tools for tracking performance across various dimensions of revenue generation. By providing real-time visibility into KPIs, they enable revenue teams to assess their progress against targets and identify areas for improvement. For example, a dashboard displaying monthly sales figures alongside targets allows teams to quickly gauge whether they are on track to meet their goals.
This immediate feedback loop is essential for maintaining motivation and accountability within the team. Furthermore, dashboards can highlight discrepancies between expected and actual performance, prompting timely interventions. If a team notices that sales figures are consistently falling short of projections, they can delve deeper into the data to uncover underlying issues—be it ineffective marketing campaigns, inadequate training for sales staff, or shifts in market demand.
This proactive approach not only helps in addressing current challenges but also aids in refining future strategies based on historical performance data.
Using Dashboards to Identify Trends and Patterns in Sales and Service Metrics
One of the most significant advantages of utilizing dashboards is their ability to reveal trends and patterns that might otherwise go unnoticed. By aggregating data over time, dashboards can illustrate how various metrics evolve, providing insights into seasonal fluctuations or long-term growth trajectories. For instance, a revenue team might observe that sales tend to spike during specific months or quarters, allowing them to prepare targeted marketing campaigns or promotional offers during those peak periods.
Additionally, dashboards can facilitate comparative analysis by allowing teams to juxtapose different metrics against one another. For example, by correlating customer satisfaction scores with sales performance, teams can identify whether higher satisfaction levels lead to increased sales or if there are other factors at play. This kind of analysis not only enhances understanding but also informs strategic decisions—such as whether to invest more resources in customer service initiatives or focus on improving product features.
The Role of Dashboards in Driving Revenue Team Accountability
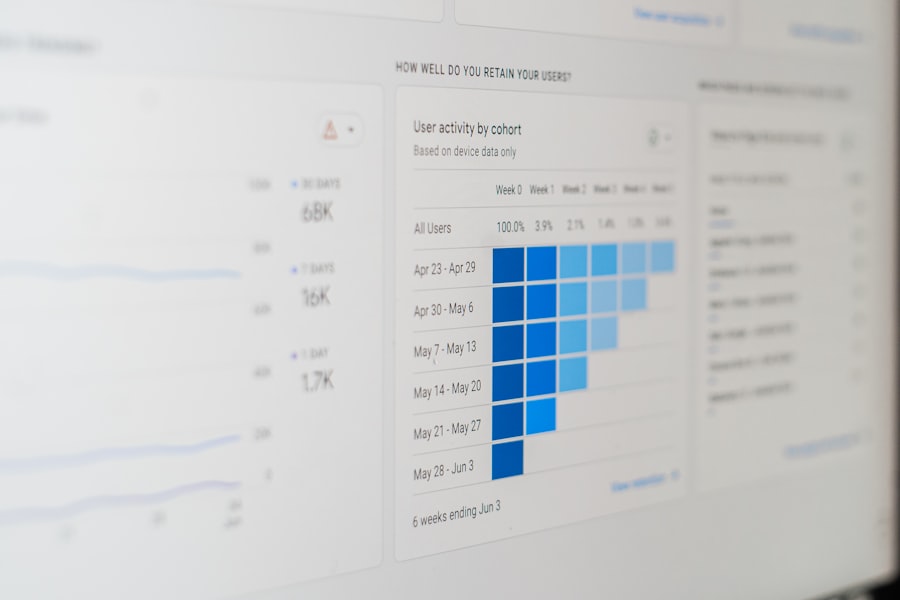
Accountability is a cornerstone of effective revenue management, and dashboards play a pivotal role in fostering this culture within teams. By making performance metrics visible to all team members, dashboards create an environment where individuals are aware of their contributions toward collective goals. This transparency encourages team members to take ownership of their responsibilities and strive for excellence in their roles.
Moreover, dashboards can facilitate regular performance reviews by providing a clear framework for evaluating individual and team contributions. For instance, during weekly or monthly meetings, team leaders can reference dashboard data to discuss achievements and areas needing improvement. This structured approach not only helps in recognizing high performers but also provides constructive feedback for those who may be struggling.
As a result, accountability becomes ingrained in the team’s culture, driving continuous improvement and higher overall performance.
Integrating Multiple Data Sources into Revenue Team Dashboards
The effectiveness of dashboards is significantly enhanced when they integrate data from multiple sources. Revenue teams often rely on various tools—such as Customer Relationship Management (CRM) systems, marketing automation platforms, and financial software—to gather insights about their operations. By consolidating data from these disparate sources into a unified dashboard, teams can gain a holistic view of their performance.
For example, integrating CRM data with marketing analytics allows revenue teams to assess how marketing efforts translate into actual sales outcomes. This integration can reveal which campaigns are most effective at generating leads that convert into customers. Additionally, combining financial data with sales metrics enables teams to evaluate profitability alongside revenue generation—providing insights into which products or services yield the highest margins.
Such comprehensive analysis empowers teams to make strategic decisions based on a complete understanding of their operational landscape.
Customizing Dashboards to Fit the Needs of Revenue Teams
Customization is key when it comes to maximizing the utility of dashboards for revenue teams. Each organization has unique goals, challenges, and workflows that necessitate tailored dashboard configurations. By allowing team members to customize their dashboards according to their specific needs—whether it’s focusing on particular metrics or adjusting visualizations—organizations can enhance user engagement and ensure that the most relevant information is readily accessible.
For instance, a sales manager might prioritize metrics related to lead generation and conversion rates on their dashboard, while a customer service leader may focus on NPS and churn rates. This level of customization not only improves usability but also ensures that each team member can track the metrics that matter most to their role. Furthermore, customizable dashboards can evolve over time as organizational priorities shift or as new metrics become relevant—ensuring that teams remain agile in their approach to performance tracking.
Leveraging Dashboards for Real-Time Decision Making
In today’s fast-paced business environment, the ability to make real-time decisions is crucial for maintaining competitive advantage. Dashboards equipped with real-time data allow revenue teams to respond swiftly to emerging trends or issues as they arise. For example, if a sudden drop in sales is detected through dashboard analytics, teams can immediately investigate potential causes—such as changes in market conditions or customer feedback—and implement corrective actions without delay.
Real-time decision-making facilitated by dashboards also extends beyond reactive measures; it enables proactive strategy formulation as well. By continuously monitoring key metrics and identifying shifts in performance patterns, revenue teams can anticipate challenges before they escalate into significant problems. This proactive stance not only mitigates risks but also positions organizations to capitalize on opportunities as they arise—ultimately driving sustained growth.
Best Practices for Implementing and Utilizing Revenue Team Dashboards
Implementing effective dashboards requires careful planning and adherence to best practices that ensure their success within revenue teams. One fundamental practice is involving end-users in the design process; gathering input from team members about what metrics they find most valuable ensures that dashboards meet actual needs rather than assumptions made by leadership alone. This collaborative approach fosters buy-in from users who are more likely to engage with tools they helped shape.
Another best practice involves regularly reviewing and updating dashboard content based on evolving business objectives or feedback from users. As organizations grow and change, so too do their priorities; ensuring that dashboards reflect current goals keeps them relevant and useful over time. Additionally, providing training sessions on how to interpret dashboard data empowers team members to leverage these tools effectively—maximizing their potential impact on decision-making processes.
The Future of Dashboards for Revenue Teams: Emerging Trends and Technologies
The landscape of dashboard technology is continually evolving, driven by advancements in data analytics and visualization tools. One emerging trend is the integration of artificial intelligence (AI) and machine learning capabilities into dashboards. These technologies enable predictive analytics that can forecast future trends based on historical data patterns—allowing revenue teams not only to react but also to anticipate changes in market dynamics.
Another significant trend is the increasing emphasis on mobile-friendly dashboard solutions that allow team members to access critical information anytime and anywhere. As remote work becomes more prevalent, having mobile-optimized dashboards ensures that revenue teams remain connected and informed regardless of their physical location. Furthermore, advancements in data visualization techniques—such as augmented reality (AR) interfaces—promise even more engaging ways for users to interact with complex datasets.
In conclusion, as organizations continue to navigate an increasingly complex business environment driven by data proliferation and technological advancements, dashboards will remain vital tools for revenue teams seeking clarity amidst chaos. The ability to visualize key metrics effectively will empower these teams not only to track performance but also to drive strategic initiatives that foster growth and sustainability in an ever-evolving marketplace.