
Visual mapping is a methodology that converts complex data and concepts into accessible visual formats through the use of diagrams, charts, and graphical representations. This approach enables individuals and organizations to organize information, reveal connections between elements, and improve comprehension. In business contexts, visual mapping addresses critical needs for effective communication and streamlined processes.
The graphical presentation of information facilitates understanding while promoting team collaboration by establishing shared reference points for analysis and decision-making. The development of visual mapping techniques began in the early 20th century, with mind mapping concepts popularized by Tony Buzan’s research and publications. The field has since expanded to incorporate diverse tools and digital technologies that support the creation of visual representations.
Contemporary business applications utilize software platforms that generate dynamic, interactive visualizations, enabling real-time modifications as projects progress. As organizations increasingly adopt visual thinking methodologies, the implementation of visual mapping has become an essential component of modern business strategy and operations.
Benefits of Visual Mapping for Business Workflows
One of the most significant advantages of visual mapping is its ability to streamline business workflows. By providing a clear visual representation of processes, teams can identify bottlenecks and inefficiencies that may not be apparent in traditional text-based documentation. For instance, a flowchart illustrating the steps in a customer service process can highlight redundancies or delays, enabling managers to implement changes that enhance efficiency.
This clarity not only improves operational performance but also empowers employees to take ownership of their roles within the workflow. Moreover, visual mapping fosters better communication among team members. In a diverse workplace where individuals may have varying levels of expertise or different perspectives on a project, visual maps serve as a universal language.
They break down complex ideas into simpler components, making it easier for everyone to contribute to discussions and collaborate effectively. For example, during brainstorming sessions, teams can use visual maps to capture ideas in real-time, ensuring that all voices are heard and that innovative solutions are developed collectively.
Creating a Visual Map for Sales and Marketing

In the realm of sales and marketing, visual mapping can be an invaluable tool for strategizing and executing campaigns. A well-structured visual map can outline the customer journey, detailing each touchpoint from awareness to conversion. By visually representing this journey, marketers can identify key opportunities for engagement and tailor their messaging accordingly.
For instance, a visual map might illustrate how potential customers interact with various marketing channels—such as social media, email campaigns, and website visits—allowing teams to optimize their strategies based on customer behavior. Additionally, visual mapping can enhance alignment between sales and marketing teams. By creating a shared visual representation of goals, target audiences, and key performance indicators (KPIs), both departments can work towards common objectives.
This alignment is crucial in ensuring that marketing efforts effectively support sales initiatives. For example, a visual map could outline the lead generation process, detailing how marketing campaigns feed into the sales pipeline. This clarity helps both teams understand their roles in driving revenue and fosters collaboration in achieving shared targets.
Visual Mapping for Product Development and Innovation
Visual mapping plays a critical role in product development and innovation by facilitating ideation and concept validation. During the early stages of product development, teams can use visual maps to brainstorm ideas and explore various design concepts. Techniques such as affinity diagrams allow teams to categorize ideas based on themes or features, making it easier to identify promising directions for further exploration.
This collaborative approach not only encourages creativity but also ensures that all team members contribute their insights. Furthermore, visual mapping aids in the validation of product concepts through user journey mapping. By visually representing how users will interact with a product or service, teams can identify potential pain points and areas for improvement before launching a final product.
For instance, a user journey map might illustrate the steps a customer takes when using a new app, highlighting moments of frustration or confusion. This insight enables product teams to make informed decisions about design modifications or feature enhancements, ultimately leading to a more user-friendly final product.
Streamlining Operations with Visual Maps
Operational efficiency is crucial for any business aiming to maximize productivity and minimize costs. Visual mapping serves as an effective tool for streamlining operations by providing a clear overview of processes and workflows. By creating process maps that outline each step involved in a particular operation—whether it’s manufacturing, logistics, or service delivery—organizations can pinpoint inefficiencies and areas for improvement.
For example, a process map detailing the supply chain can reveal delays in procurement or distribution that may be hindering overall performance. In addition to identifying inefficiencies, visual maps can also facilitate training and onboarding for new employees. By providing new hires with visual representations of operational processes, organizations can accelerate the learning curve and ensure that employees understand their roles within the larger context of the business.
This approach not only enhances knowledge retention but also fosters a culture of continuous improvement as employees become more engaged in optimizing workflows.
Enhancing Customer Service with Visual Mapping
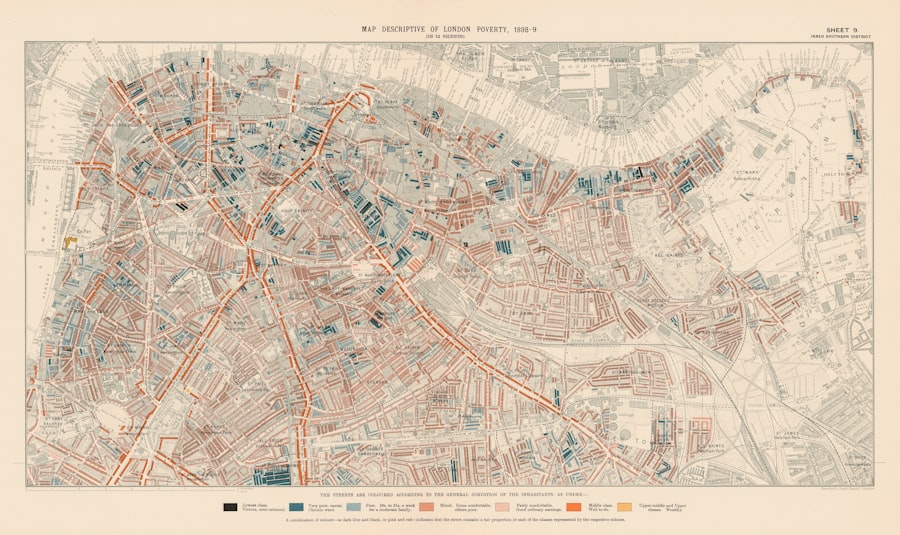
Customer service is an area where visual mapping can significantly enhance performance by improving response times and overall customer satisfaction. By creating visual maps that outline customer service processes—such as handling inquiries or resolving complaints—organizations can ensure that employees have a clear understanding of their responsibilities and the steps required to address customer needs effectively. For instance, a service process map might detail how customer inquiries are triaged based on urgency or complexity, allowing representatives to prioritize their responses accordingly.
Moreover, visual mapping can be used to analyze customer feedback and identify trends in service quality. By visually representing data collected from customer surveys or support tickets, organizations can quickly spot recurring issues or areas where service may be lacking. This insight enables businesses to implement targeted improvements that enhance the overall customer experience.
For example, if a visual analysis reveals that customers frequently express dissatisfaction with response times during peak hours, management can allocate additional resources or adjust staffing levels accordingly.
Visual Mapping for Financial Management and Budgeting
In financial management and budgeting, visual mapping provides clarity and insight into complex financial data. By creating visual representations of budgets, forecasts, and financial reports, organizations can better understand their financial health and make informed decisions about resource allocation. For instance, a budget map might illustrate how funds are distributed across various departments or projects, allowing stakeholders to see where investments are being made and where adjustments may be necessary.
Additionally, visual mapping can enhance financial forecasting by enabling teams to visualize trends over time. By plotting historical financial data on graphs or charts, organizations can identify patterns that inform future projections. This approach allows finance teams to present data in a way that is easily understandable for non-financial stakeholders, fostering collaboration across departments when discussing budgetary priorities or investment opportunities.
Integrating Visual Maps into Project Management
Project management is another domain where visual mapping proves invaluable in ensuring successful project execution. Gantt charts and Kanban boards are popular examples of visual tools used to track project timelines and task progress. These visual representations provide project managers with an overview of project status at a glance, enabling them to identify potential delays or resource constraints early on.
For example, a Gantt chart might highlight overlapping tasks that could lead to scheduling conflicts, allowing managers to reallocate resources proactively. Furthermore, integrating visual maps into project management enhances team collaboration by providing a shared platform for communication and updates. Team members can contribute to project maps in real-time, ensuring that everyone is aligned on objectives and deadlines.
This collaborative approach fosters accountability as team members can easily see their responsibilities within the larger project context. Additionally, it encourages open dialogue about challenges or changes in scope, ultimately leading to more successful project outcomes.
Using Visual Mapping for Human Resources and Employee Onboarding
In human resources (HR), visual mapping serves as an effective tool for streamlining processes related to recruitment, onboarding, and employee development. By creating visual representations of HR workflows—such as the recruitment process or employee performance evaluation—HR professionals can ensure consistency and clarity in their practices. For instance, a recruitment process map might outline each stage from job posting to candidate selection, helping HR teams maintain transparency throughout the hiring process.
Visual mapping also plays a crucial role in employee onboarding by providing new hires with clear guidance on company policies, procedures, and expectations. Onboarding maps can visually represent the steps new employees need to take during their first weeks on the job—such as completing paperwork or attending training sessions—ensuring they have a comprehensive understanding of their roles from day one. This structured approach not only enhances the onboarding experience but also contributes to higher employee retention rates as new hires feel more supported during their transition into the organization.
Implementing Visual Maps for Quality Control and Process Improvement
Quality control is essential for maintaining high standards in products and services across industries. Visual mapping facilitates quality control efforts by providing clear frameworks for monitoring processes and identifying areas for improvement. Techniques such as flowcharts or control charts allow organizations to visualize quality metrics over time, enabling them to detect deviations from established standards quickly.
For example, a control chart might illustrate variations in product quality during manufacturing runs, helping teams pinpoint specific factors contributing to defects. Moreover, visual mapping supports continuous process improvement initiatives by enabling teams to analyze workflows critically. By creating value stream maps that outline each step in a process—from raw materials to finished products—organizations can identify wasteful practices or inefficiencies that hinder quality outcomes.
This analysis empowers teams to implement targeted improvements that enhance overall quality while reducing costs.
Harnessing the Power of Visual Maps for Business Success
The integration of visual mapping into various business functions offers numerous benefits that contribute to overall success. From enhancing communication and collaboration among teams to streamlining operations and improving customer service, visual maps serve as essential tools for navigating complex business landscapes. As organizations continue to embrace digital transformation and seek innovative solutions to drive growth, harnessing the power of visual mapping will undoubtedly play a pivotal role in achieving strategic objectives.
By adopting visual mapping techniques across departments—from sales and marketing to finance and human resources—businesses can foster a culture of clarity and collaboration that empowers employees at all levels. As technology continues to evolve, so too will the tools available for creating dynamic visual maps that adapt to changing business needs. Ultimately, organizations that leverage these powerful visualization techniques will be better positioned to thrive in an increasingly competitive marketplace.